-
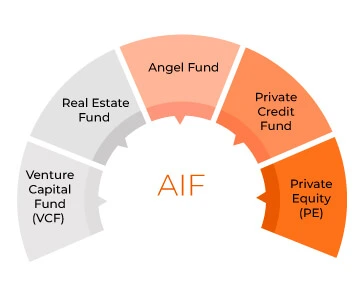
APMI-registered distributor 250+ fund partners ₹1 Cr minimum investment Explore all AIF
-
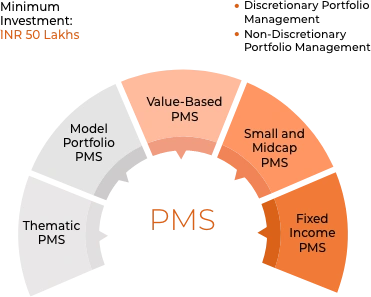
₹50 Lakhs minimum Direct ownership of securities 250+ fund partners Explore all PMS
-
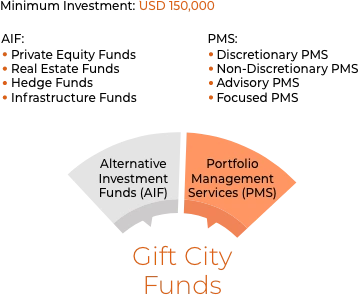
USD 150,000 minimum IFSCA-regulated Tax-efficient structure Learn about GIFT City
-
Get in TouchContact UsSend us a messageBook a MeetingFree 30-min consultationCall Us+91 95616 10108WhatsApp UsInstant chat supportWork With UsPartner With UsBecome a distribution partnerCareersJoin the ALTPORT teamSupport HoursMon – Sat10:00 AM – 6:00 PM IST


 Verified Investor