
The Sunil Singhania portfolio is closely followed by investors researching India's listed companies, emerging businesses and institutional investment activity. Sunil Singhania is the founder of Abakkus Asset Manager, an investment management firm established in 2018. His career includes senior equity-management responsibilities at Reliance Capital and Reliance Mutual Fund.
Sunil Singhania is also covered in ALTPORT's top investors in India research, which compares prominent Indian investors and their reported portfolios.
The interest in sunil singhania portfolio 2026 extends beyond a list of company names. Investors want to know which companies appear in the latest disclosures, how much is reported against each position, which stakes have changed and what the numbers reveal about sector exposure.
However, public portfolio trackers do not all report the same universe of holdings. One September 2026 snapshot reports approximately ₹3,714.20 crore across 44 stocks, another reports ₹1,564.25 crore in a narrower holdings dataset, and a third reports ₹1,851.25 crore across 27 stocks.
These figures must not be added together or treated as interchangeable estimates of personal wealth. They reflect different portfolio-tracking datasets, reporting coverage and potentially different valuation methods.
Key statistics of Sunil Singhania Portfolio
| Metric | Reported figure |
| Year of Abakkus establishment | 2018 |
| Broad disclosed-holdings snapshot | 44 stocks |
| Broad snapshot value | ₹3,714.20 crore |
| Alternative holdings dataset | ₹1,564.25 crore |
| Another tracked portfolio | 27 stocks |
| Value of the 27-stock portfolio | ₹1,851.25 crore |
| Largest disclosed stake in the detailed table below | 5.34% |
| Highest individual holding value in the detailed table below | ₹245.59 crore |
Data cut-off: October 2026 research, with September 2026 quarter-end figures where available. Some company filings may still be pending, so not every September figure represents a completed reporting set.
Sunil Singhania: Profile, Career and Investment Approach
Sunil Singhania is a Chartered Financial Analyst (CFA) and the founder of Abakkus Asset Manager LLP. Before establishing Abakkus, he held senior investment roles within Reliance Capital and led equity strategies at Reliance Mutual Fund, now part of Nippon India Mutual Fund.
During his earlier career, he also contributed to international investment initiatives and institutional mandates. His professional experience spans portfolio construction, listed-equity investing and investment management.
| Profile detail | Information |
| Name | Sunil Singhania |
| Professional qualification | CFA charterholder |
| Current professional association | Founder of Abakkus Asset Manager LLP |
| Abakkus established | 2018 |
| Previous senior role | Global Head – Equities, Reliance Capital |
| Previous investment leadership | CIO – Equities, Reliance Mutual Fund |
| Investment focus | Indian equities, business fundamentals and long-term growth |
| Strategies associated with his firm | PMS, AIF and other investment structures |
| Publicly disclosed holdings | Reported through company and investment-vehicle disclosures, depending on the position |
Sunil Singhania Portfolio is often discussed in connection with long-term equity investing and identifying businesses with the potential to compound earnings. His earlier leadership of Reliance Growth Fund is associated with substantial long-term growth over its operating history, although past performance should not be interpreted as a guarantee of future results.
The MEETS investment framework
A useful way to understand the investment philosophy associated with Abakkus is the MEETS framework.
| Component | What it examines | Questions investors should ask |
| M — Management | Quality, integrity and execution | Does management allocate capital responsibly? |
| E — Earnings | Sustainability and earnings quality | Are profits supported by cash generation? |
| E — Events and trends | Industry changes and emerging opportunities | Is the business positioned to benefit from structural changes? |
| T — Timing | Valuation and entry price | Is the current valuation reasonable? |
| S — Structural | Market opportunity, scalability and competitive advantage | Can the business grow while maintaining attractive economics? |
The framework is particularly relevant when examining sunil singhania stocks, because a disclosed stake alone says little about the quality of the underlying business or the price at which it was acquired.
Sunil Singhania Stock Holdings: Company Names and Disclosed Stakes
The following table consolidates the detailed holdings available in the September 2026 reporting dataset, including historical stake percentages and estimated market values where supplied.
These are reported public-equity holdings associated with the tracked portfolio universe. They should not automatically be described as personal investments. A dash indicates that no percentage was shown in the relevant period; “Filing due” means the latest reporting entry was not available in that dataset.
Detailed holdings table
| Company | Sep 2025 | Dec 2025 | Mar 2026 | Jun 2026 | Sep 2026 | Reported value (₹ crore) |
| Carysil | 5.34% | 5.34% | 5.34% | 5.34% | 5.34% | 146.86 |
| DCM Shriram Industries | 2.86% | 2.86% | 2.86% | 2.81% | 2.81% | 12.21 |
| Dynamatic Technologies | 2.94% | 2.94% | 2.94% | 2.94% | 2.94% | 245.59 |
| H.G. Infra Engineering | 1.36% | 1.36% | 1.36% | 1.36% | Filing due | 33.74 |
| Himatsingka Seide | 5.53% | 5.53% | 4.33% | — | Filing due | 0.00 |
| Hindware Home Innovation | 4.56% | 4.56% | 4.56% | 1.46% | 1.46% | 19.85 |
| IIFL Capital Services | 2.50% | 2.49% | 2.49% | 1.24% | Filing due | 133.24 |
| Ion Exchange (India) | 1.85% | 1.85% | 1.85% | 1.85% | Filing due | 91.62 |
| J. Kumar Infraprojects | 2.48% | 2.48% | 2.48% | 2.48% | 2.48% | 78.86 |
| Jubilant Pharmova | 1.15% | 1.15% | 1.15% | 1.15% | 1.15% | 172.18 |
| Mastek | 2.85% | 2.77% | 1.27% | 1.27% | — | 0.00 |
| Rupa & Company | 3.98% | 3.98% | 3.72% | 3.42% | 1.57% | 14.75 |
| Sarda Energy & Minerals | 1.06% | — | — | — | — | 0.00 |
| Siyaram Silk Mills | 1.59% | 1.59% | 1.59% | 1.59% | 1.59% | 34.45 |
| SPR Auto Technologies | 1.03% | 1.03% | 1.03% | — | Filing due | 0.00 |
| Stylam Industries | 2.09% | 2.09% | 2.09% | 2.09% | 1.98% | 104.04 |
| Technocraft Industries (India) | — | 2.36% | — | 2.28% | 2.21% | 125.68 |
| The Anup Engineering | 3.55% | 3.55% | 3.58% | 3.57% | Filing due | 95.66 |
| TTK Healthcare | 1.13% | — | — | 2.07% | — | 0.00 |
| Mangal Electrical Industries | 2.89% | 2.89% | 2.89% | 2.89% | 2.89% | 19.46 |
| Indogulf Cropsciences | 4.02% | 4.02% | 4.02% | 4.02% | 3.48% | 12.91 |
| Jaro Institute of Technology Management and Research | 2.28% | 2.28% | 2.28% | 2.27% | Filing due | 18.59 |
| M&B Engineering | 2.03% | 2.03% | 2.03% | 2.03% | 2.03% | 29.32 |
| Suven Life Sciences | 1.31% | 1.31% | 1.13% | 1.07% | — | 0.00 |
| DCM Shriram Fine Chemicals | — | 2.86% | — | 2.86% | 2.86% | 6.15 |
| DCM Shriram International | — | 2.86% | 2.86% | 2.86% | 2.86% | 15.62 |
| Sejal Glass | — | — | 4.39% | 4.39% | Filing due | 42.27 |
| Afcom Holdings | — | — | — | 1.97% | 1.95% | 74.13 |
| Paramount Communications | — | — | — | — | 1.96% | 37.07 |
The table preserves the reported figures and their limitations. A zero value or dash should not be interpreted as proof that a security has no economic exposure across all investment vehicles.
What stands out in the holdings?
Three positions have reported values above ₹140 crore in this dataset: Dynamatic Technologies at ₹245.59 crore, Jubilant Pharmova at ₹172.18 crore and Carysil at ₹146.86 crore.
IIFL Capital Services is also significant at ₹133.24 crore, followed by Technocraft Industries at ₹125.68 crore and Stylam Industries at ₹104.04 crore.
These numbers are useful for identifying the largest reported positions by estimated market value. They do not establish which holdings represent the largest proportion of a consolidated portfolio, because the table may not cover every investment or use the same valuation basis as other tracking datasets.
Largest Reported Holdings by Value in Sunil Singhania Portfolio
The reported holding values provide a more meaningful ranking than share quantity alone.
| Rank | Company | Reported value (₹ crore) | Reported stake |
| 1 | Dynamatic Technologies | 245.59 | 2.94% |
| 2 | Jubilant Pharmova | 172.18 | 1.15% |
| 3 | Carysil | 146.86 | 5.34% |
| 4 | IIFL Capital Services | 133.24 | 1.24% in Jun 2026; Sep filing due |
| 5 | Technocraft Industries | 125.68 | 2.21% |
| 6 | Stylam Industries | 104.04 | 1.98% |
| 7 | The Anup Engineering | 95.66 | 3.57% in Jun 2026; Sep filing due |
| 8 | Ion Exchange (India) | 91.62 | 1.85% in Jun 2026; Sep filing due |
| 9 | J. Kumar Infraprojects | 78.86 | 2.48% |
| 10 | Afcom Holdings | 74.13 | 1.95% |
The value ranking and the ownership-percentage ranking are different. Carysil's reported stake of 5.34% is higher than Dynamatic Technologies' 2.94%, but the estimated market value of the Dynamatic position is larger.
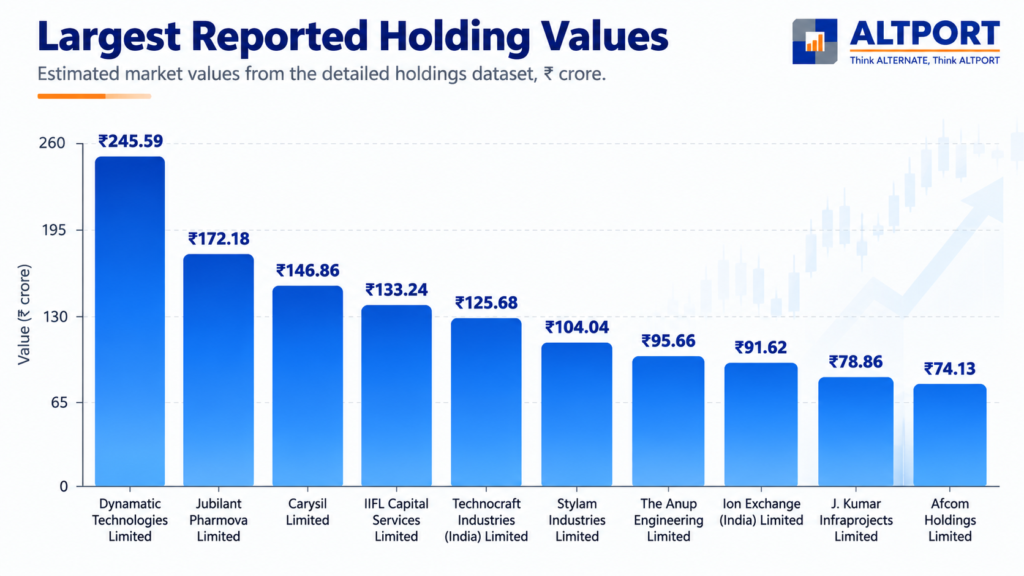
This is why sunil singhania portfolio research should include both disclosed ownership and estimated market value.
Sunil Singhania Portfolio Changes: Latest Reporting Period vs Previous Period
Quarterly comparisons can reveal where reported ownership has changed materially.
The most significant movements in the five-quarter table include reductions in Rupa & Company and Indogulf Cropsciences, along with changes in Hindware Home Innovation and IIFL Capital Services.
| Company | Sep 2025 stake | Jun 2026 stake | Sep 2026 stake | Change from Sep 2025 to latest reported stake |
| Rupa & Company | 3.98% | 3.42% | 1.57% | -2.41 percentage points |
| Indogulf Cropsciences | 4.02% | 4.02% | 3.48% | -0.54 percentage points |
| Hindware Home Innovation | 4.56% | 1.46% | 1.46% | -3.10 percentage points |
| Stylam Industries | 2.09% | 2.09% | 1.98% | -0.11 percentage points |
| Technocraft Industries | — | 2.28% | 2.21% | Not comparable from Sep 2025 |
| DCM Shriram Industries | 2.86% | 2.81% | 2.81% | -0.05 percentage points |
| Carysil | 5.34% | 5.34% | 5.34% | No change |
| Dynamatic Technologies | 2.94% | 2.94% | 2.94% | No change |
| J. Kumar Infraprojects | 2.48% | 2.48% | 2.48% | No change |
| Jubilant Pharmova | 1.15% | 1.15% | 1.15% | No change |
A percentage-point reduction is not automatically proof of a sale by the fund manager personally. It may reflect changes in the legal holder, share capital or reporting coverage. The correct interpretation requires matching the exact holder and scheme across periods.
New positions and recent additions
The June 2026 reporting notes also identify additions or increases in Arvind Fashions, Afcom Holdings, TTK Healthcare and Cyient DLM.
| Company | Reported development | Period |
| Arvind Fashions | Stake increased by 0.8 percentage points | June 2026 |
| Afcom Holdings | New reported position of 1.97% | June 2026 |
| TTK Healthcare | New reported position of 2.07% | June 2026 |
| Cyient DLM | Stake increased by 0.3 percentage points | June 2026 |
| Paramount Communications | Reported at 1.96% in the September dataset | September 2026 |
The latest quarter may show additional entries because filings arrive at different times. The absence of a company from a partial September list should not be treated as a confirmed exit.
Sector-Wise Breakdown of the Disclosed Stock Holdings in Sunil Singhania Portfolio
The companies in the disclosed holdings span several industries, including industrial manufacturing, healthcare, consumer products, financial services and infrastructure.
A precise sector-allocation chart would require market values for the complete and consistently defined portfolio universe. The following table classifies representative holdings and identifies the most relevant metrics for further analysis.
| Sector | Representative holdings | Key business indicators |
| Industrial and engineering | Dynamatic Technologies, The Anup Engineering, Technocraft Industries, M&B Engineering | Order book, margins, execution and return on capital |
| Infrastructure | H.G. Infra Engineering, J. Kumar Infraprojects | Project execution, working capital and order inflows |
| Consumer and home products | Carysil, Hindware Home Innovation, Rupa & Company, Stylam Industries, Siyaram Silk Mills | Volume growth, pricing, brand strength and distribution |
| Healthcare and pharmaceuticals | Jubilant Pharmova, TTK Healthcare, Suven Life Sciences | Product pipeline, margins, regulatory exposure and research investment |
| Financial services | IIFL Capital Services | Revenue mix, capital strength and market-cycle sensitivity |
| Environmental services | Ion Exchange | Order execution, industrial demand and cash conversion |
| Agriculture-related businesses | Indogulf Cropsciences | Seasonal demand, distribution and product economics |
| Automotive components | SPR Auto Technologies | Capacity utilisation, customer concentration and execution |
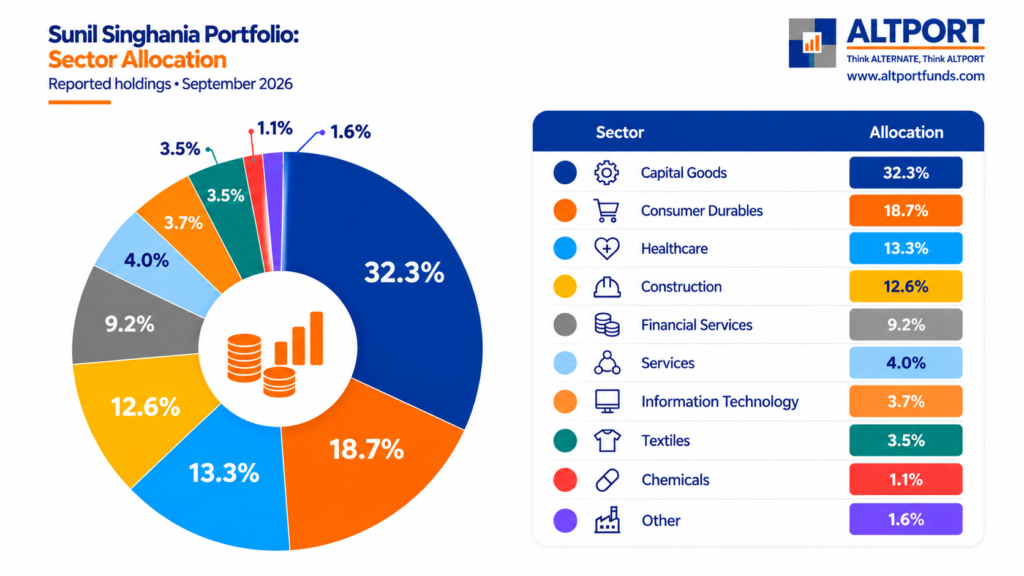
A high number of companies in a sector does not necessarily imply a high capital allocation. A proper sector allocation must be weighted by the market value of each position.
Why Portfolio Values and Holding Counts Differ
Different portfolio-tracking datasets can report different numbers of holdings and estimated values because they do not necessarily include the same securities.
| Dataset snapshot | Reported holdings | Reported value |
| Broad disclosed-holdings universe | 44 stocks | ₹3,714.20 crore |
| Alternative reported universe | Different coverage | ₹1,564.25 crore |
| Separate portfolio-tracking snapshot | 27 stocks | ₹1,851.25 crore |
| Curated portfolio screener | 24 stocks | Metrics based on its selected list |
These figures are not a time series and should not be interpreted as gains or losses between reporting periods. They differ in scope and potentially in valuation date.
The estimated value of a holding is normally calculated by multiplying the reported share quantity by the applicable share price. If the price changes, the estimated value changes even when the share quantity stays the same.
The Sunil Singhania portfolio 2026 should therefore be reported with a clear definition of the included holdings, reporting date and valuation method.
What the Disclosed Holdings Cannot Tell Investors
Publicly disclosed holdings can reveal reported ownership, but they cannot establish every part of an investment decision.
They do not necessarily reveal the manager's complete investment thesis, the expected holding period, the original purchase price or all assets managed across different investment schemes.
They also cannot establish personal net worth by themselves. Assets held by an AIF or a client PMS account are not automatically personal assets of the investment manager.
For investors, the most important next step is to analyse the businesses independently. Revenue growth, earnings quality, debt, cash flow, return on capital and valuation all matter when deciding whether a company merits further research.
How to Verify the Latest Shareholding Disclosures
A robust verification process should include the following steps.
- Confirm the exact company and legal shareholder
- Check the reporting quarter and filing date
- Record the reported share quantity and percentage
- Compare the same holder's position with the previous quarter
- Check for revised filings and corporate actions
- Review relevant bulk and block deal disclosures
- Calculate market value using a stated price date
- Label estimates separately from reported figures
- Document missing filings and other limitations
Bulk and block deal disclosures can provide additional evidence about qualifying transactions, but they do not represent complete portfolio statements. The applicable disclosure thresholds and reporting requirements depend on the transaction and regulatory framework.
Where These Holdings Sit: Accessing Abakkus Strategies
Abakkus operates investment strategies across portfolio management services and alternative investment funds. The specific scheme matters because mandates, holdings, liquidity arrangements and risk limits can differ.
| Strategy | Broad investment focus | Reported inception |
| Abakkus Emerging Opportunities Approach | Small- and mid-cap | August 2020 |
| Abakkus All Cap Approach | Multi-cap and flexi-cap | October 2020 |
| Abakkus Diversified Alpha Approach | Multi-cap and flexi-cap | January 2024 |
| Abakkus Emerging Opportunities Fund-1 | Small- and mid-cap | June 2019 |
| Abakkus Growth Fund-2 | Mid- and large-cap | November 2021 |
| Abakkus Diversified Alpha Fund | Multi-cap and flexi-cap | December 2022 |
| Abakkus Diversified Alpha Fund-2 | Multi-cap and flexi-cap | November 2023 |
| Abakkus Flexi Edge Fund-1 | Multi-cap and flexi-cap | August 2025 |
| Abakkus Four2Eight Opportunities Fund | Private equity and pre-IPO | 2024 |
These products should not be treated as one consolidated portfolio. The holdings of a particular scheme must be verified against its own disclosures and governing documents.
Conclusion: What Investors Should Take Away
The Sunil Singhania Portfolio is useful as a starting point for studying reported ownership, business exposure and quarterly changes. The available data identifies several substantial reported positions, including Dynamatic Technologies, Jubilant Pharmova, Carysil and IIFL Capital Services.
At the same time, the differences between reported portfolio values underline the importance of checking the reporting universe before making comparisons. A holding associated with an investment scheme is not automatically a personal investment, and a reported stake is not a recommendation to buy.
For more information about Sunil Singhania, visit his page: Sunil Singhania Portfolio.
Check out his podcast with ALTPORT on Youtube.
Disclaimer
This article is for educational and informational purposes only and does not constitute investment advice or a recommendation to buy or sell any security. Portfolio holdings and values may change, and reported data may be incomplete or revised. Equities, PMS and AIF products involve risk, including the possible loss of capital. Readers should independently verify all information and consult a qualified financial adviser before making investment decisions.